PROJECT
EcoEurope (personal project)
Digital Product proposal UX/UI
ROLE
UX/UI Designer
PROYECTO
Craiglist (proyecto personal)
Propuesta rediseño Home UX/UI
ROL
UX/UI Designer
PROJECT
EcoEurope (personal project)
Digital Product proposal
ROLE
UX/UI Product Designer
RESPONSABILITIES
Research
Wireframing
Prototyping
User Flow
Interaction Design
UI Design
RESPONSABILIDADES
Research
User flow
Wireframes
Diseño UI
RESPONSABILITIES
Research
Wireframing
Prototyping
User Flow
Interaction Design
UI Design
Context
ECOEurope is an ecological project designed by one of the biggest European agricultural cooperatives. The objective is to create a production chain that provides the population with sustainable and ecological products at a competitive and accessible price in the European markets.
Contexto
Craigslist es uno de los sitios web más populares del mundo. Es un sitio web gratuito que permite a cualquiera ver y publicar anuncios clasificados. Además, Craigslist también permite a sus usuarios buscar trabajos, unirse a foros de discusión y encontrar una vivienda. Presta servicios a más de 450 ciudades de todo el mundo.
Context
ECOEurope is an ecological project designed by one of the biggest European agricultural cooperatives. The objective is to create a production chain that provides the population with sustainable and ecological products at a competitive and accessible price in the European markets.
Challenge
To develop a digital tool that will allow farmers to evaluate, through the introduction of European reference data, the situation of the different key factors that will influence the final location of their plantations.
How could we provide ECOEurope users with the necessary information to make their decisions through a simple and easily understandable experience?
Reto
Craiglist tiene un diseño básico y anticuado pero funciona porque mantiene el foco en las tareas primarias del usuario: comprar y vender servicios/productos. Permite al usuario alcanzar fácilmente sus objetivos, sin importar lo bonito que sea.
Crear un diseño más atractivo y mejorar la usabilidad es muy factible, pero hacerlo manteniendo la esencia de la empresa y el sitio web no es tan fácil.
¿Cómo atacar los principales pain points que genera en los usuarios la experiencia actual, manteniendo esa esencia simplista característica de Craiglist?
Challenge
To develop a digital tool that will allow farmers to evaluate, through the introduction of European reference data, the situation of the different key factors that will influence the final location of their plantations.
How could we provide ECOEurope users with the necessary information to make their decisions through a simple and easily understandable experience?
Methodology
Metodología
Methodology
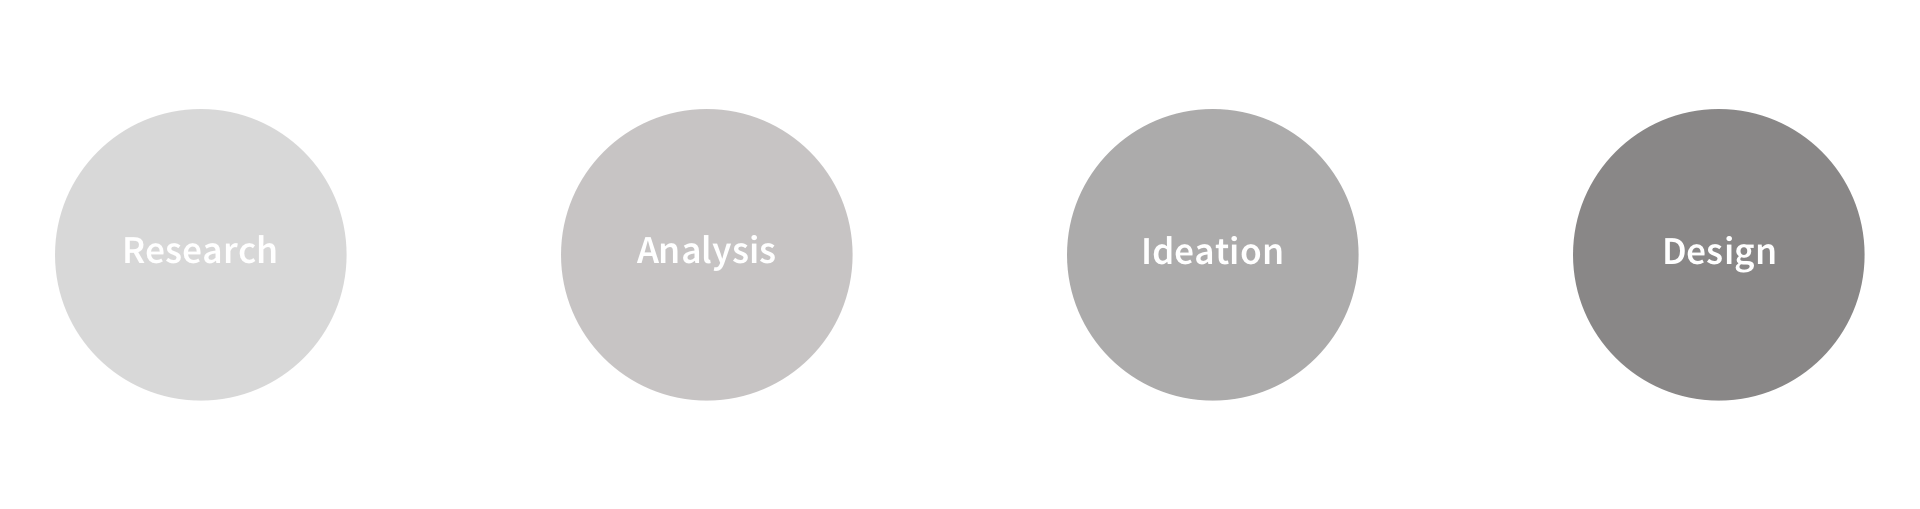
01 Discover
01 Discover
What are our users like?
Trend analysis
Empathizing with our users
What are our users like?
Trend analysis
Empathizing with our users
/What are our users like?
/What are our users like?
The first thing will be to understand who and how are the users we want to design the experience for. Ideally, we would start with surveys or interviews or field studies, but due to our deadline, we will work with the data we can collect from the different reports available.
In our case, since we are dealing with users from the rural environment, one of the most important factors will be to know the degree of relationship between with the technology and their cultural level, in order to develop a tool that is easy to understand and an interface with which they can interact in a simple way.
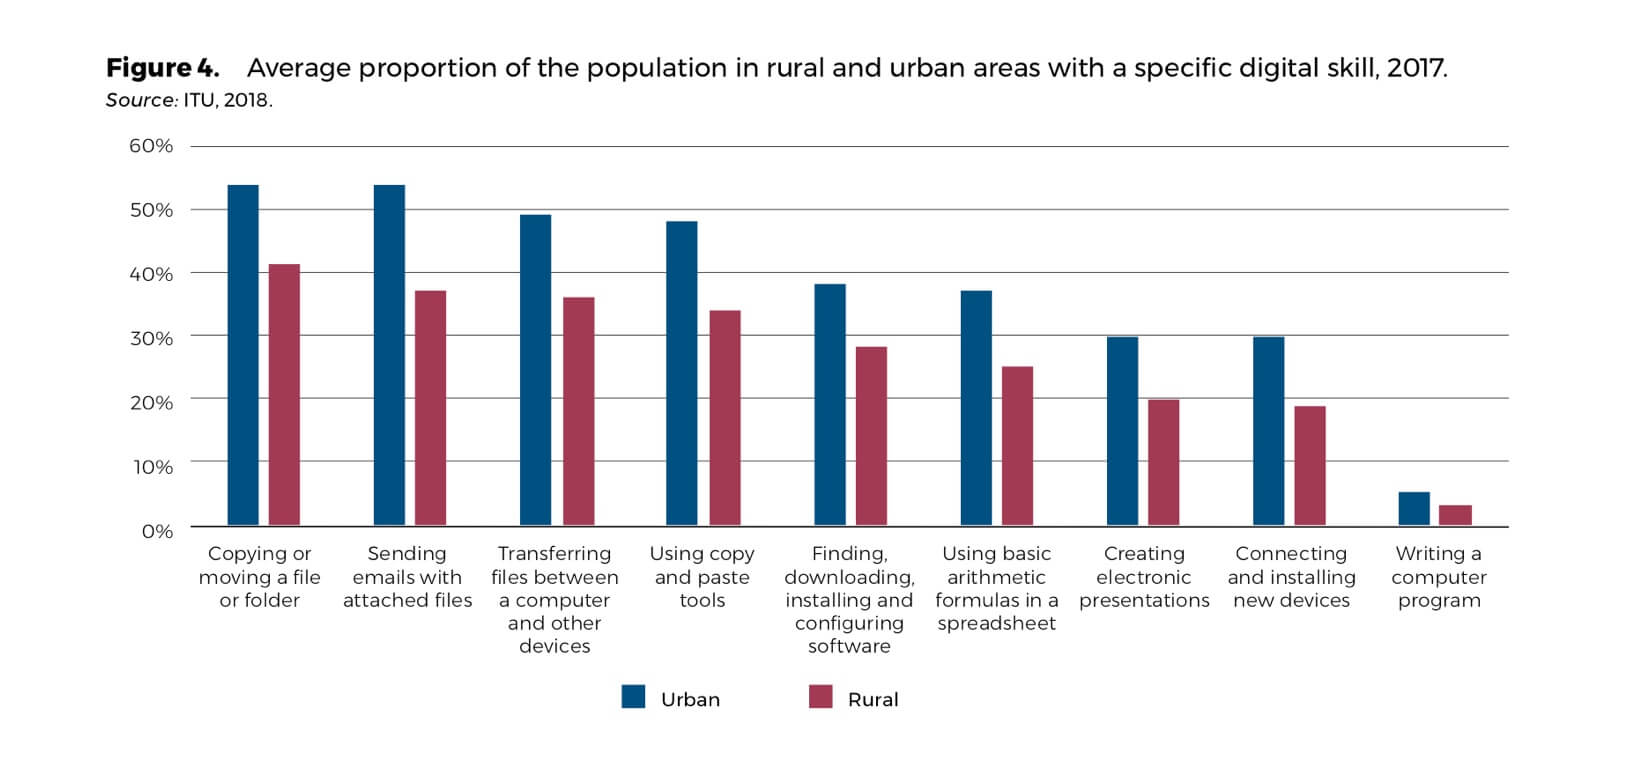
Source: Food and Agriculture Organization of the United Nations (FAO)
Source: Food and Agriculture Organization of the United Nations (FAO)
CONCLUSIONS
CONCLUSIONS
The reports indicate that our users, inhabitants of the European rural world, have a higher cultural level and access to technology than in other continents and that the penetration of mobile devices in this environment follows the same dynamic, with quite high rates.
The reports indicate that our users, inhabitants of the European rural world, have a higher cultural level and access to technology than in other continents and that the penetration of mobile devices in this environment follows the same dynamic, with quite high rates.
/Trend analysis
/Trend analysis
What is happening in the agricultural sector?
We will then analyze the sector, to determine what the trends are in terms of the digitalization of the agricultural sector and what other similar products we can we find that will help us to achieve the best solutions for the our experience design.
What is happening in the agricultural sector?
We will then analyze the sector, to determine what the trends are in terms of the digitalization of the agricultural sector and what other similar products we can we find that will help us to achieve the best solutions for the our experience design.
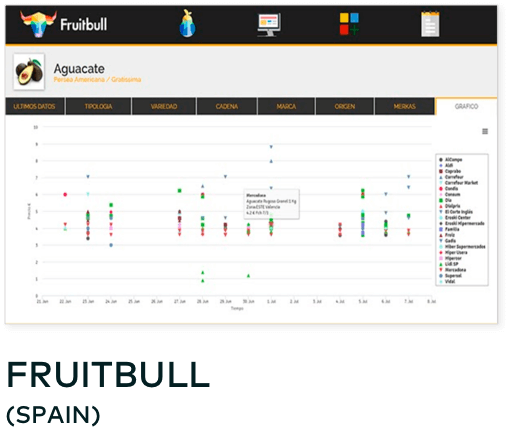
Application that allows to know in real time the retail price of fruits and vegetables in real time, making it easier for its users to decide the optimal time for harvesting and buying and selling. It is aimed at both producers and distributors.
Application that allows to know in real time the retail price of fruits and vegetables in real time, making it easier for its users to decide the optimal time for harvesting and buying and selling. It is aimed at both producers and distributors.
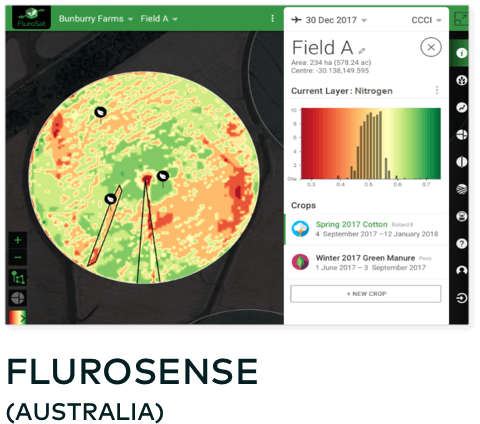
Application that allows to know in real time an advanced agronomic analysis engine that incorporates decades of research in agricultural modeling with artificial intelligence, provides crop yield monitoring and early stress detection. Through spectral analysis, it helps in monitoring and early, cost-effective decision making.
Application that allows to know in real time an advanced agronomic analysis engine that incorporates decades of research in agricultural modeling with artificial intelligence, provides crop yield monitoring and early stress detection. Through spectral analysis, it helps in monitoring and early, cost-effective decision making.
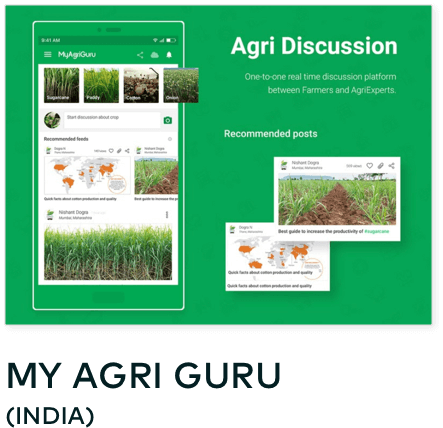
Farmers' advisory platform. Includes data from the Indian Meteorological Institute with a five-day weather forecast The Market Price Section shares real-time supply prices. In addition to information on seeds, Agribuzz (farmer networking forum) and content on best practices, innovation, tip of the day and latest news.
Farmers' advisory platform. Includes data from the Indian Meteorological Institute with a five-day weather forecast The Market Price Section shares real-time supply prices. In addition to information on seeds, Agribuzz (farmer networking forum) and content on best practices, innovation, tip of the day and latest news.
CONCLUSIONS
CONCLUSIONS
The digitalization of the rural environment is advancing strongly and we find many digital products that help users to be more effective in making decisions and managing their resources.
The digitalization of the rural environment is advancing strongly and we find many digital products that help users to be more effective in making decisions and managing their resources.
/Empathizing
/Test de usabilidad
/Empathizing
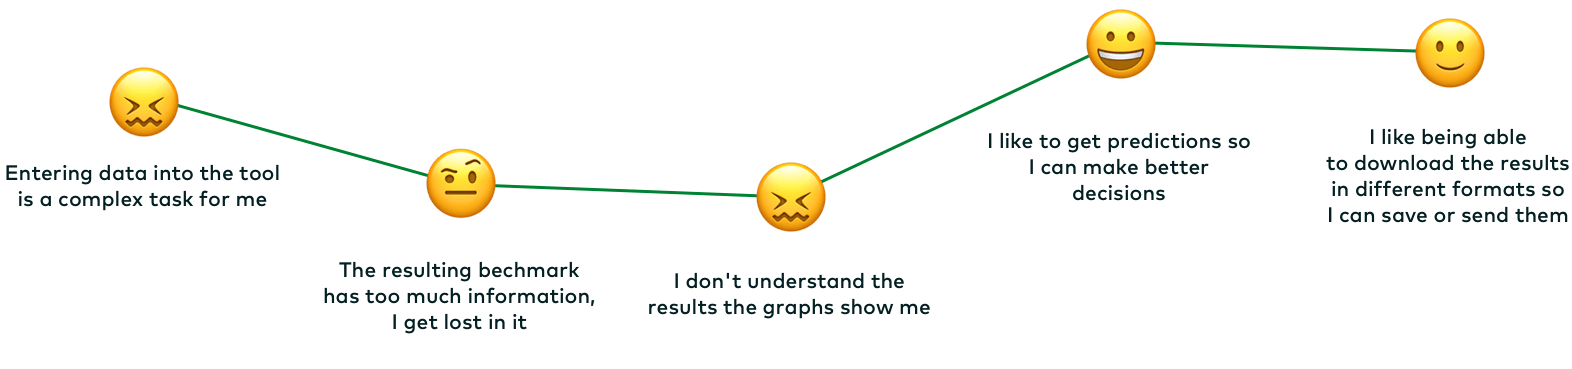
Finally, we will make User Personas, Empathy Maps and User Proto-Journeys to deepen the knowledge of our users in order to better empathize with them.
The resulting analysis will provide us with user insights that will lead us to better understand their problems in order to propose better solutions.
CONCLUSIONS
CONCLUSIONS
Our typology of users demand practical technological solutions that help them solve their problems in a simple way without complicating their lives. (Making things the job easier). Otherwise a tool whose handling in the way of entering their data or the way in which the information provided by the tool displayed in an arduous way or difficult to understand, it would generate a high level of frustration.
Our typology of users demand practical technological solutions that help them solve their problems in a simple way without complicating their lives. (Making things the job easier). Otherwise a tool whose handling in the way of entering their data or the way in which the information provided by the tool displayed in an arduous way or difficult to understand, it would generate a high level of frustration.
02 Ideation
02 Ideation
Strategic Keys
Interaction flow
Wireframing & Prototyping
Data Visualization
Visual Design
Strategic Keys
Interaction flow
Wireframing & Prototyping
Data Visualization
Visual Design
/Strategic Keys
When designing our experience we will start by pointing out the objectives of the site and understand the needs of the user.
To do this we will rely on the following strategic keys:

AGILE DATA COLLECTION
Users must be able to enter data in an easy and fast way so that this step does not generate pain points to them.

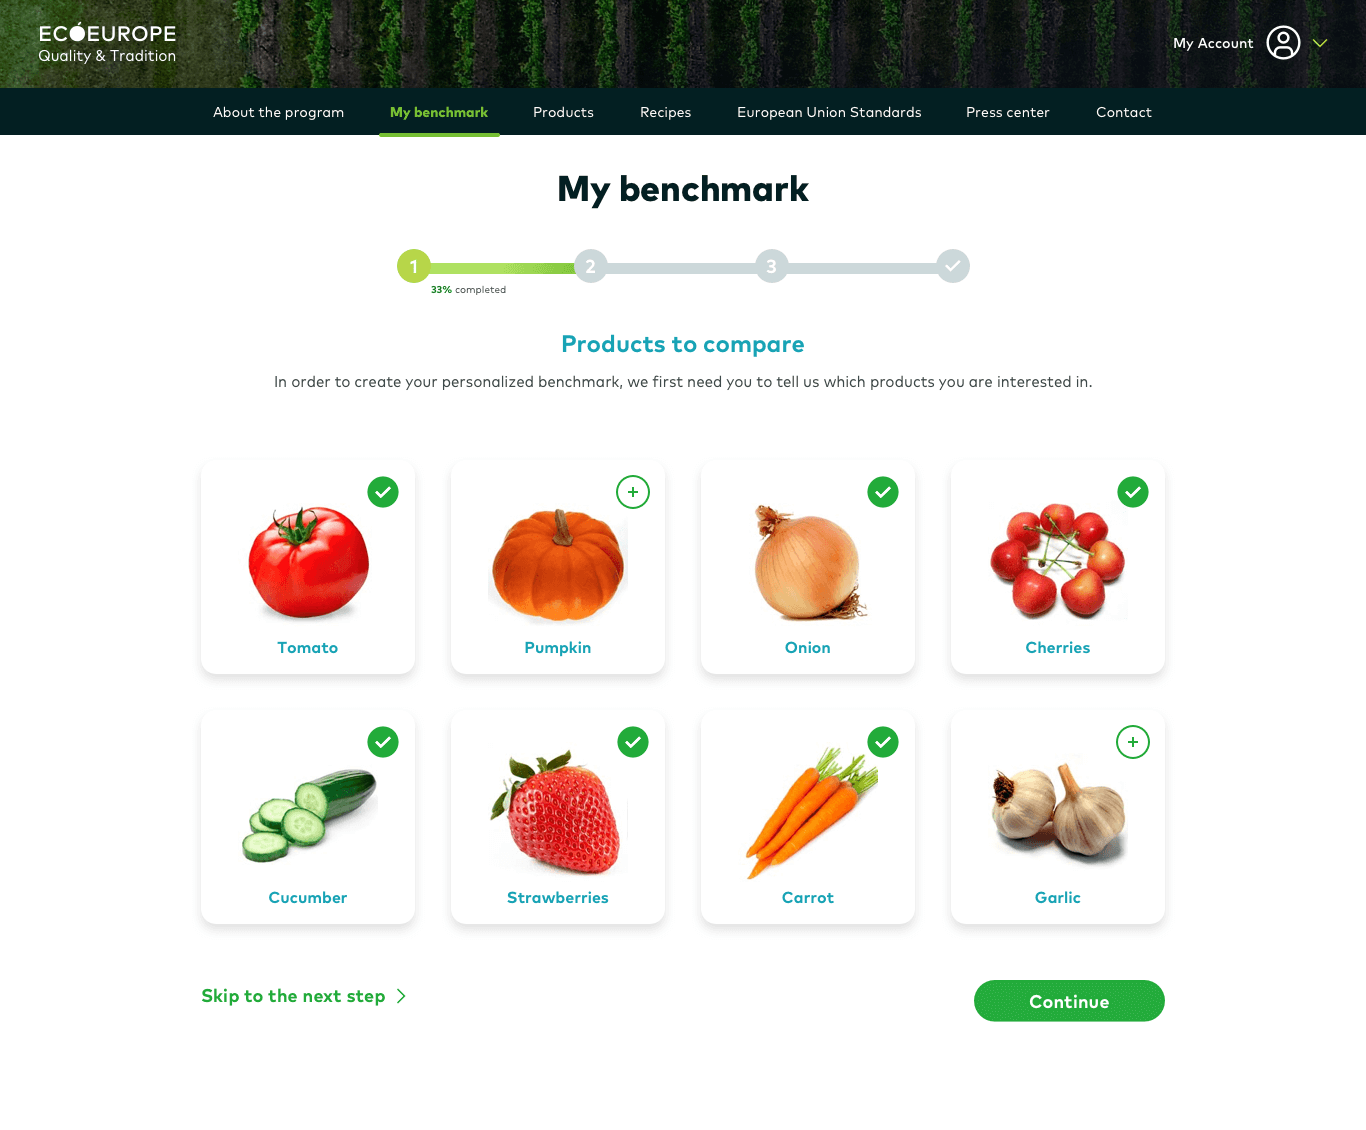
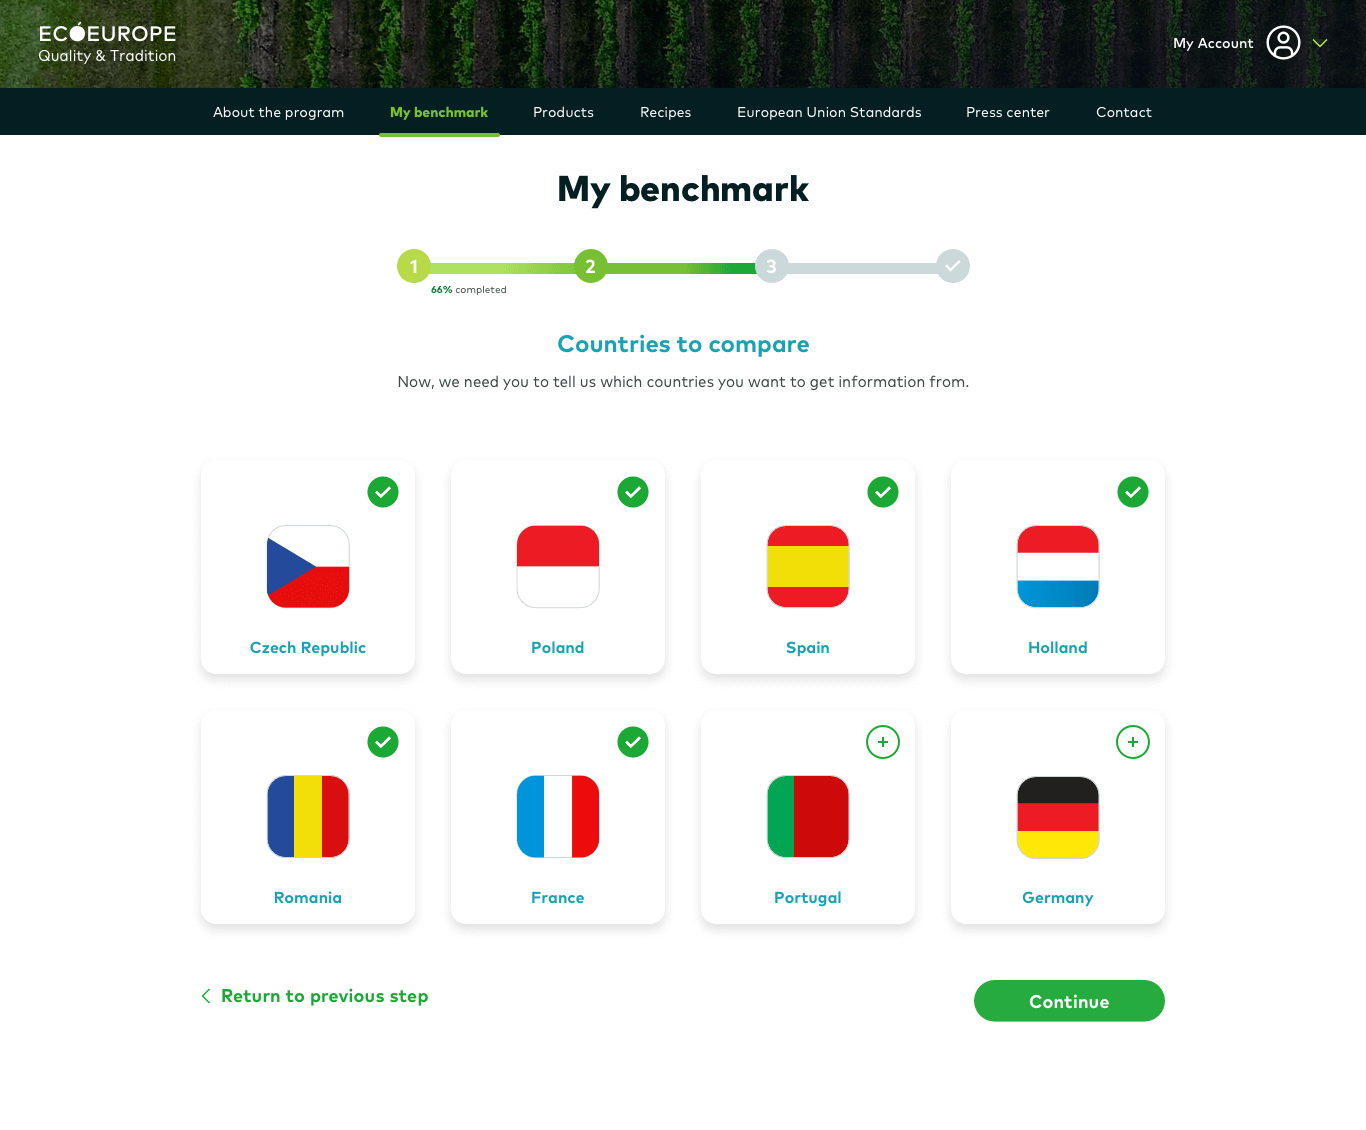
PERSONALIZATION
We must generate a personalized experience for the interests of each user. They must be able to determine at all times what information they need and what not, so as not to overwhelm them with an excess of data that does not provide them with value.

SIMPLE VISUALIZATION OF THE USEFULL DATA
The information shown through graphics must be understood at a first glance, so we have to find the best visual solution to show each type of information.
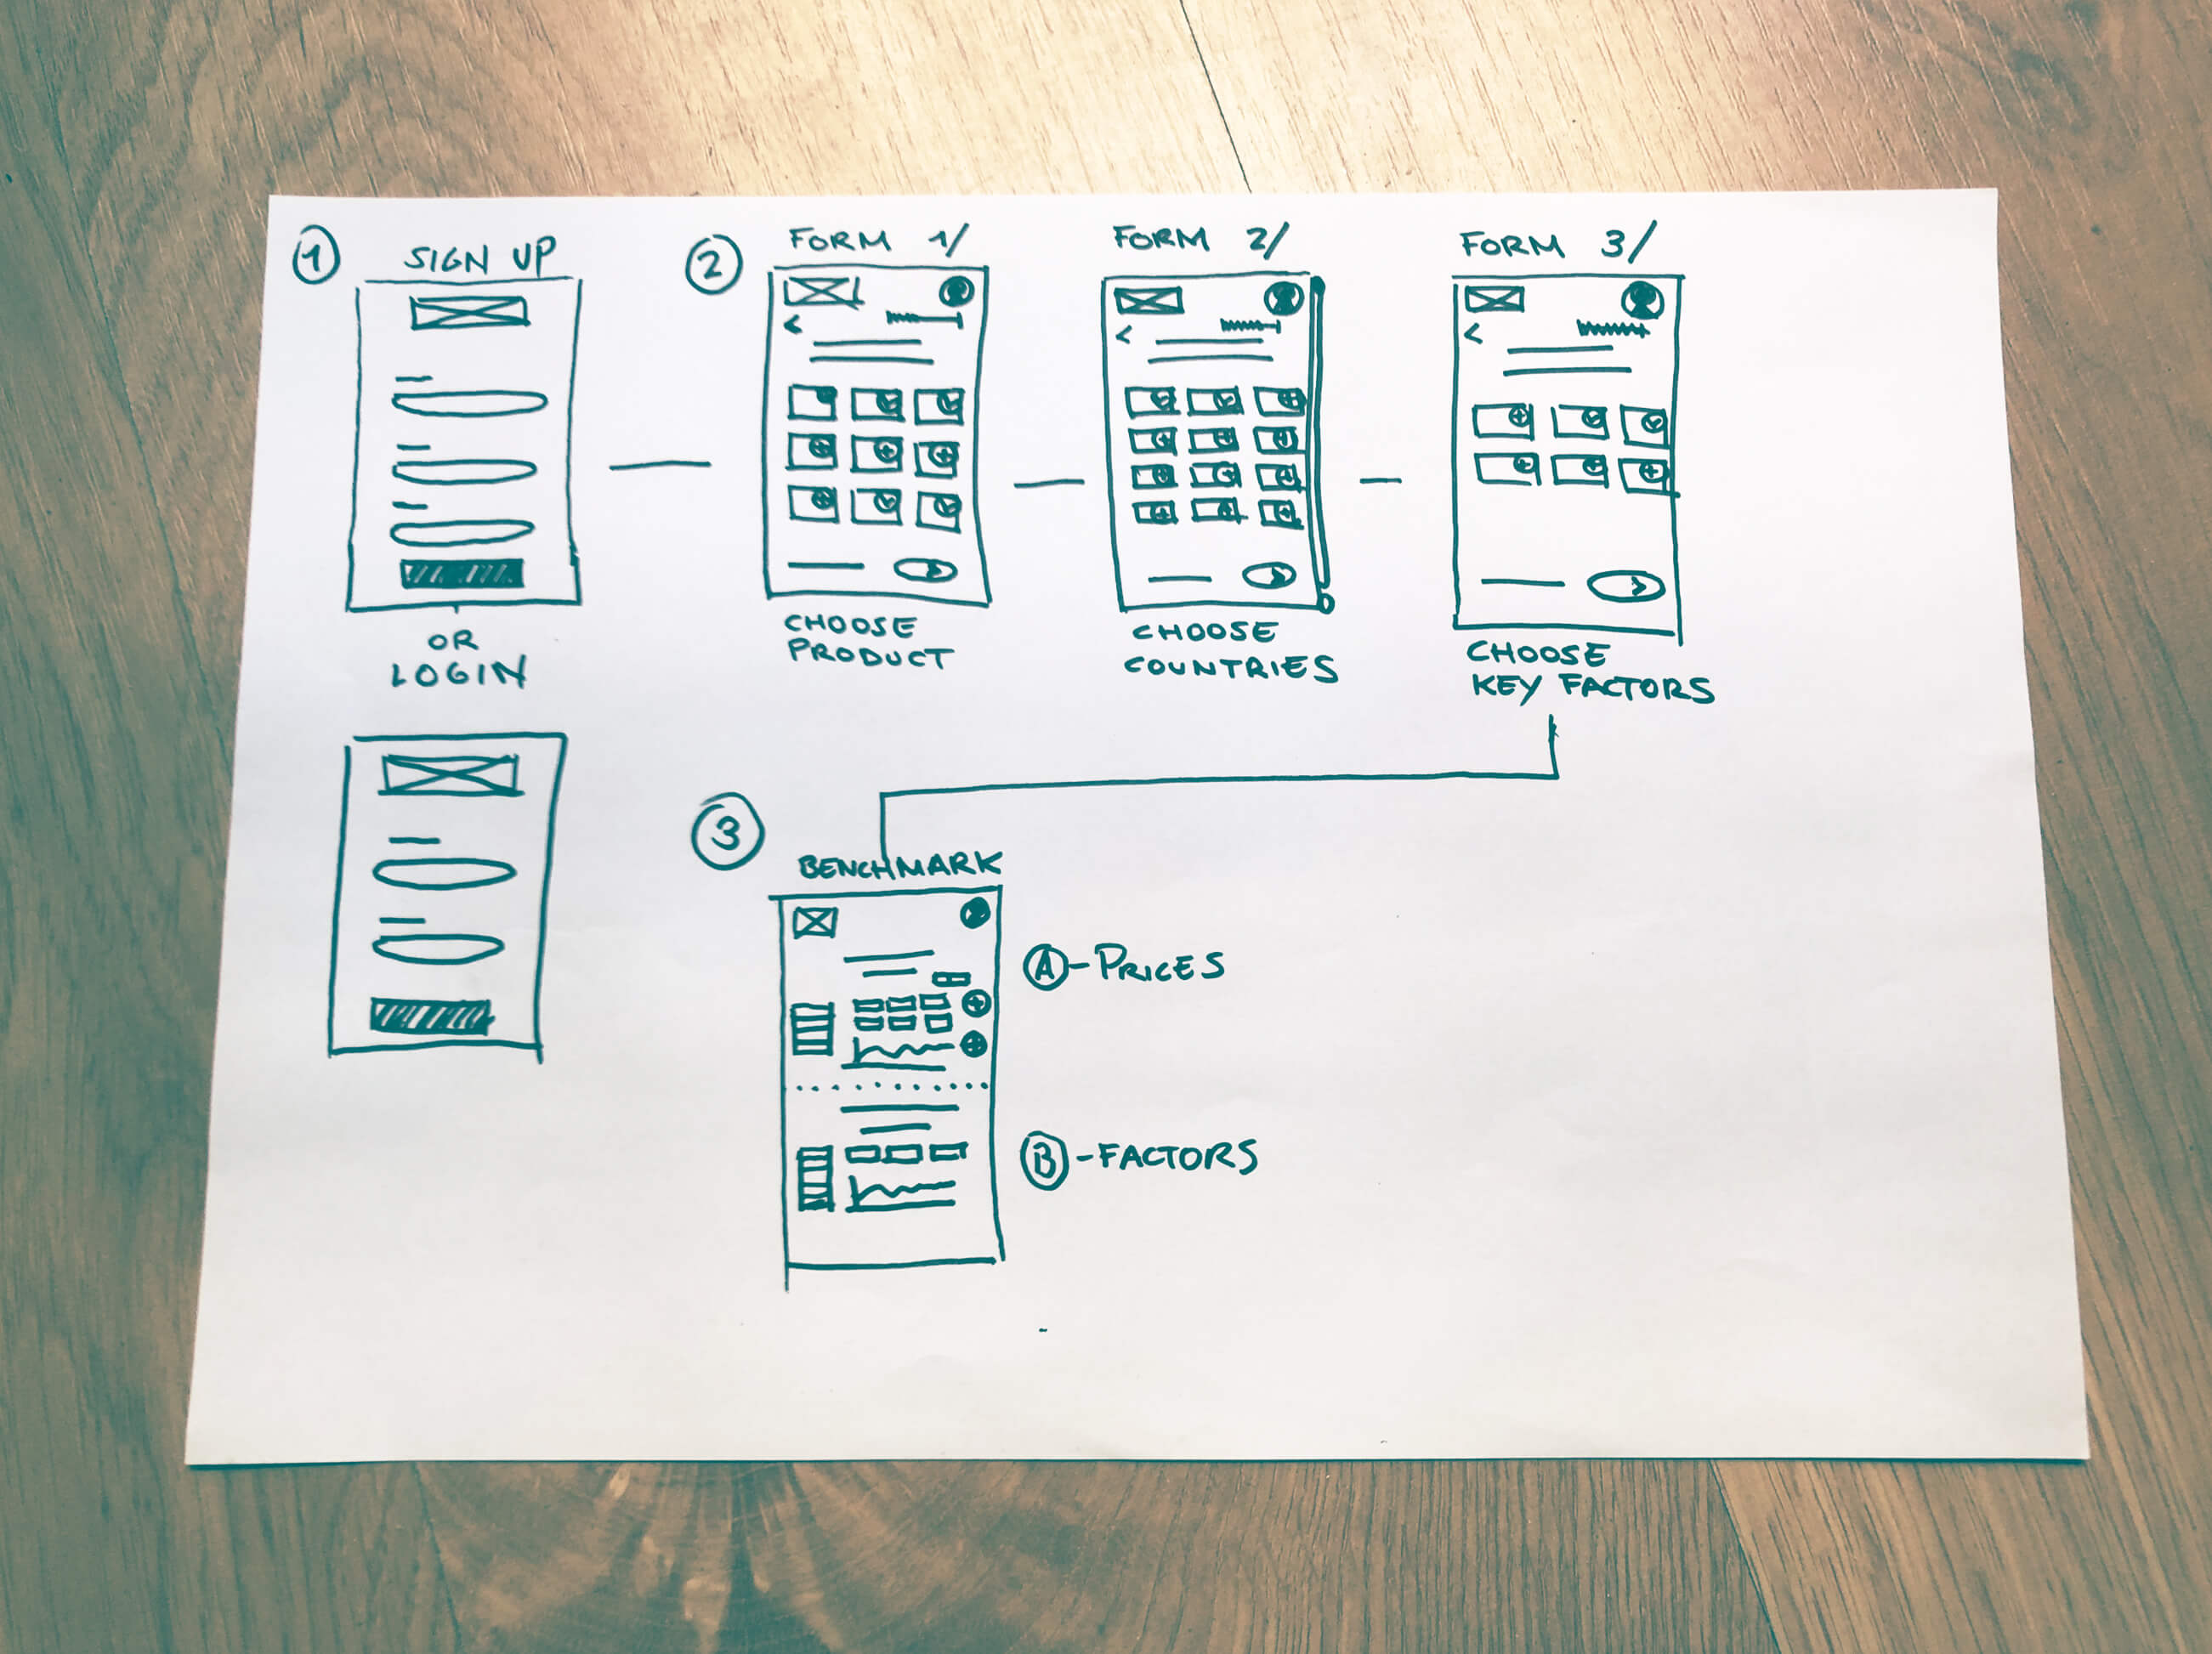
/Interaction flow and wireframing
To meet our deadline we have to proceed in a very lean way at this stage, so we will use the paper to make our lo-fi wireframes of our solutions, test them and find out their strengths and weaknesses.
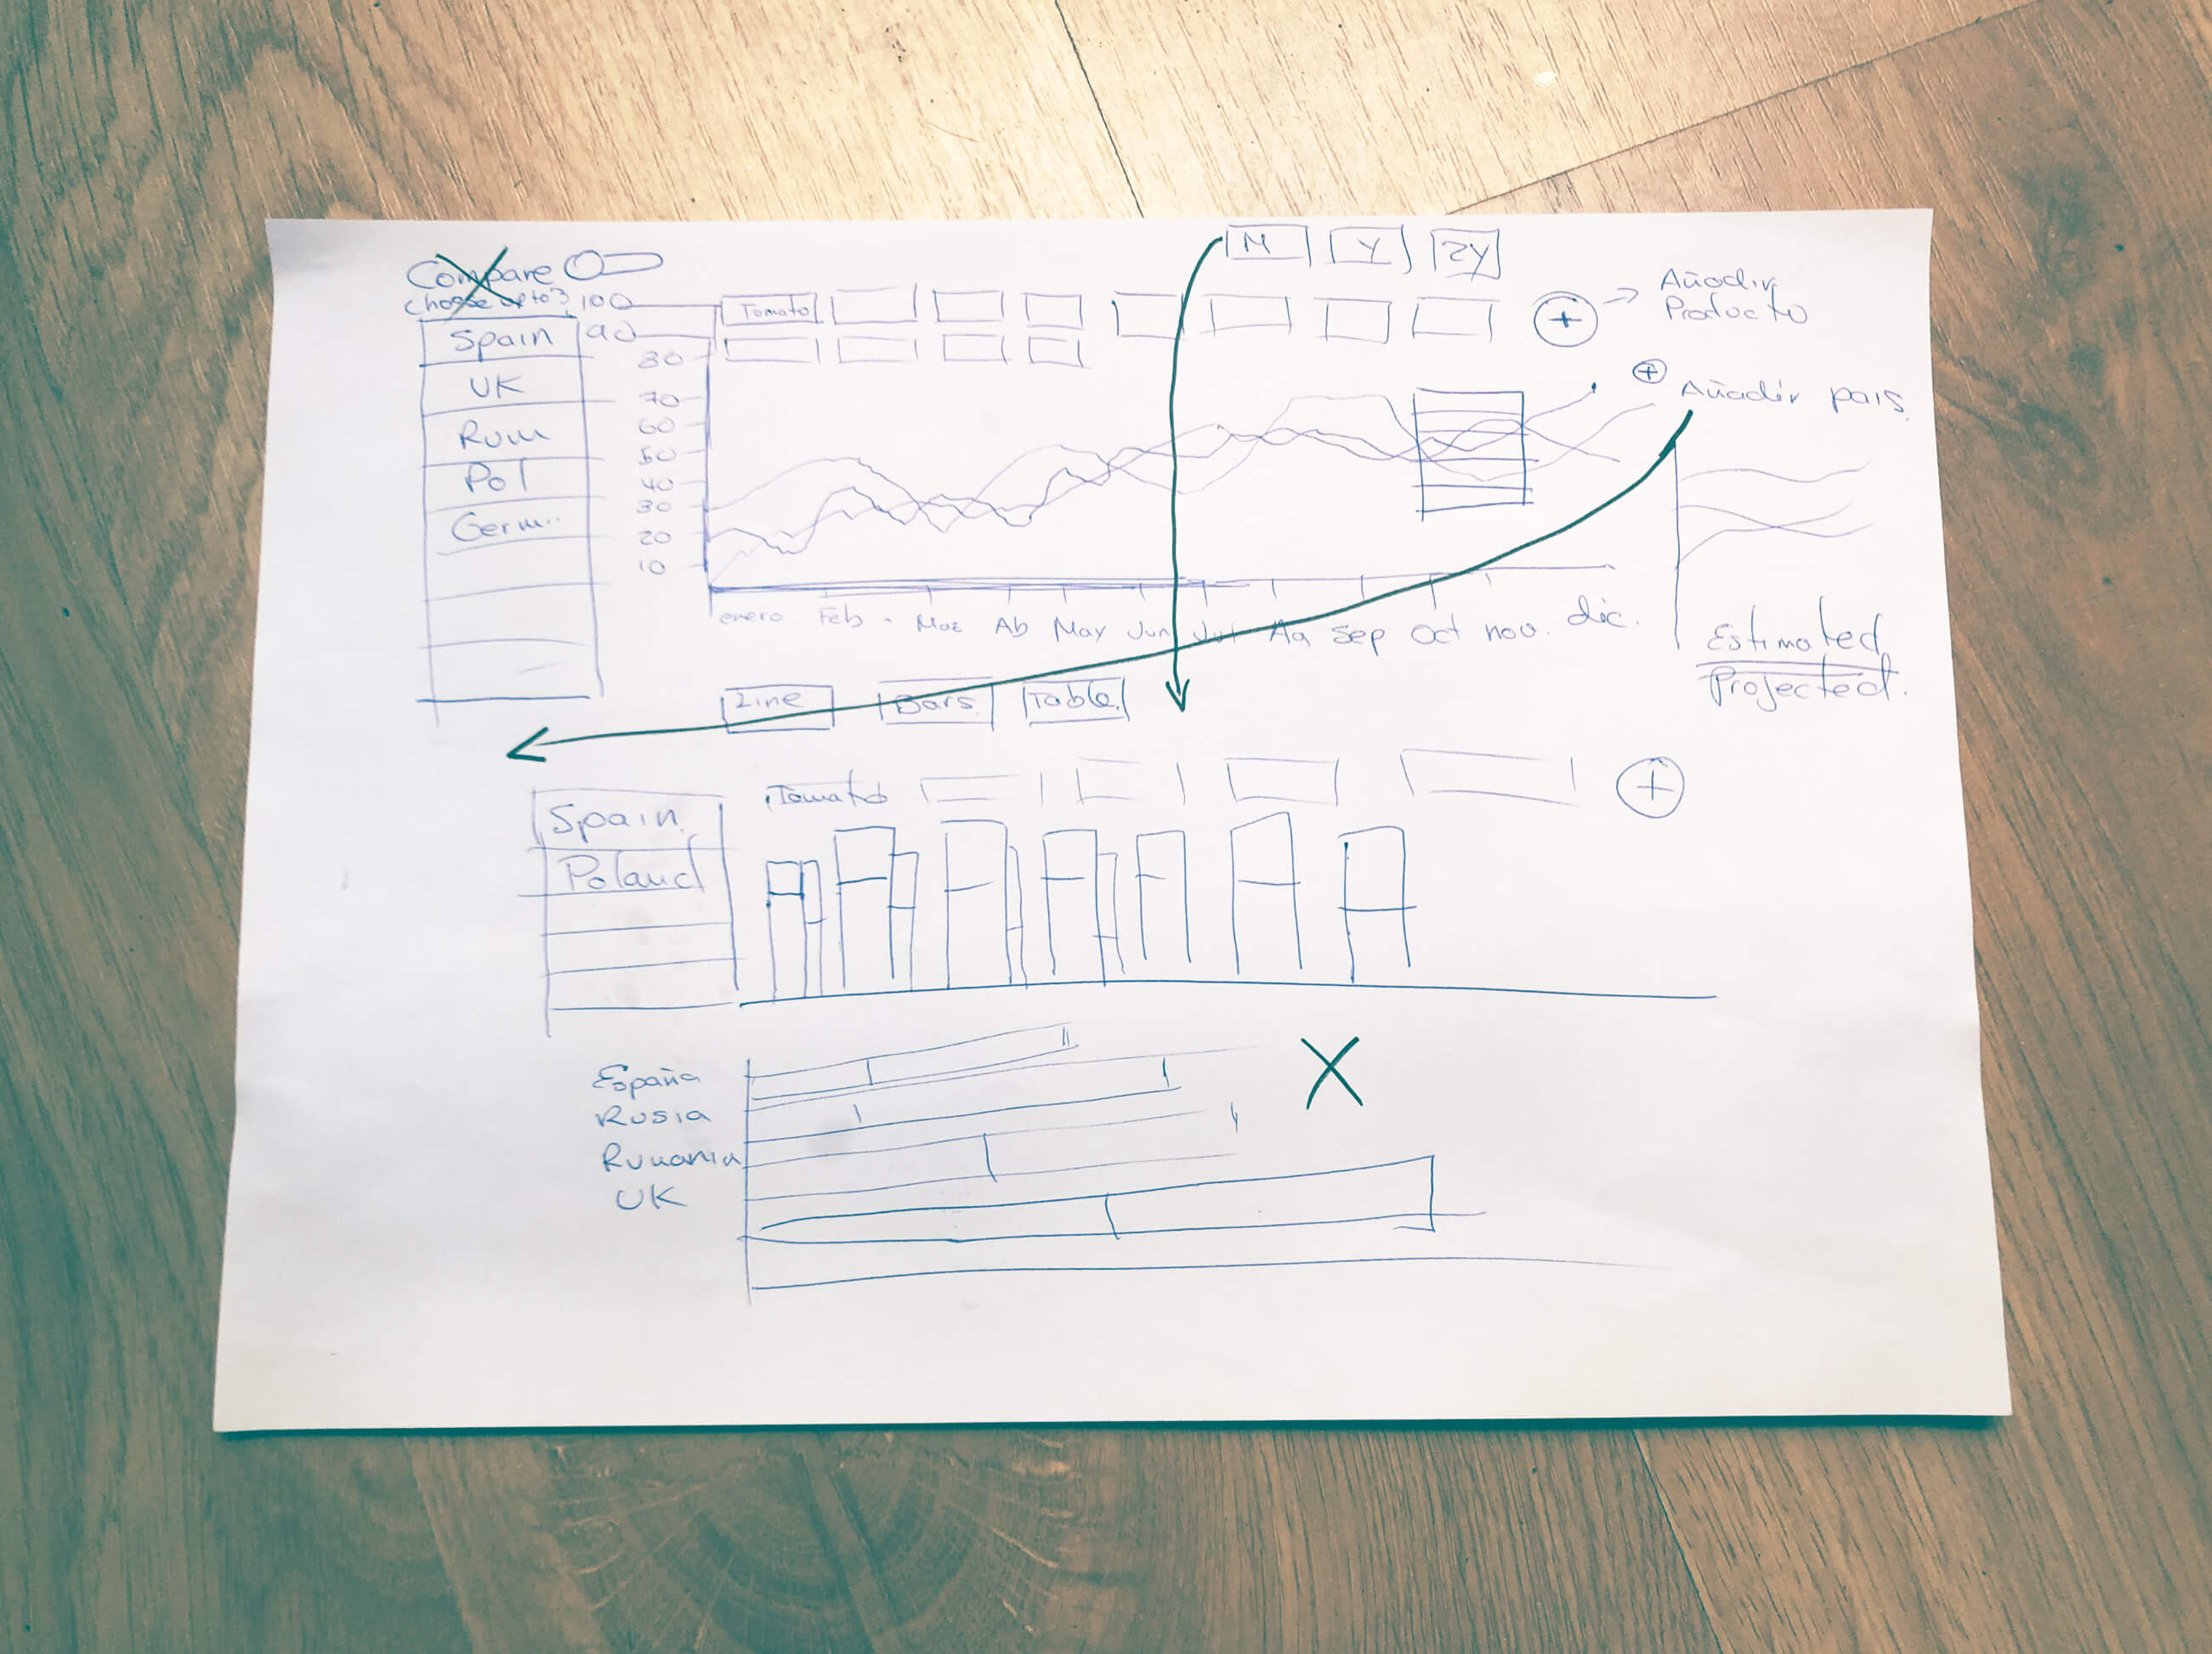
CONCLUSIONS
INSIGHTS
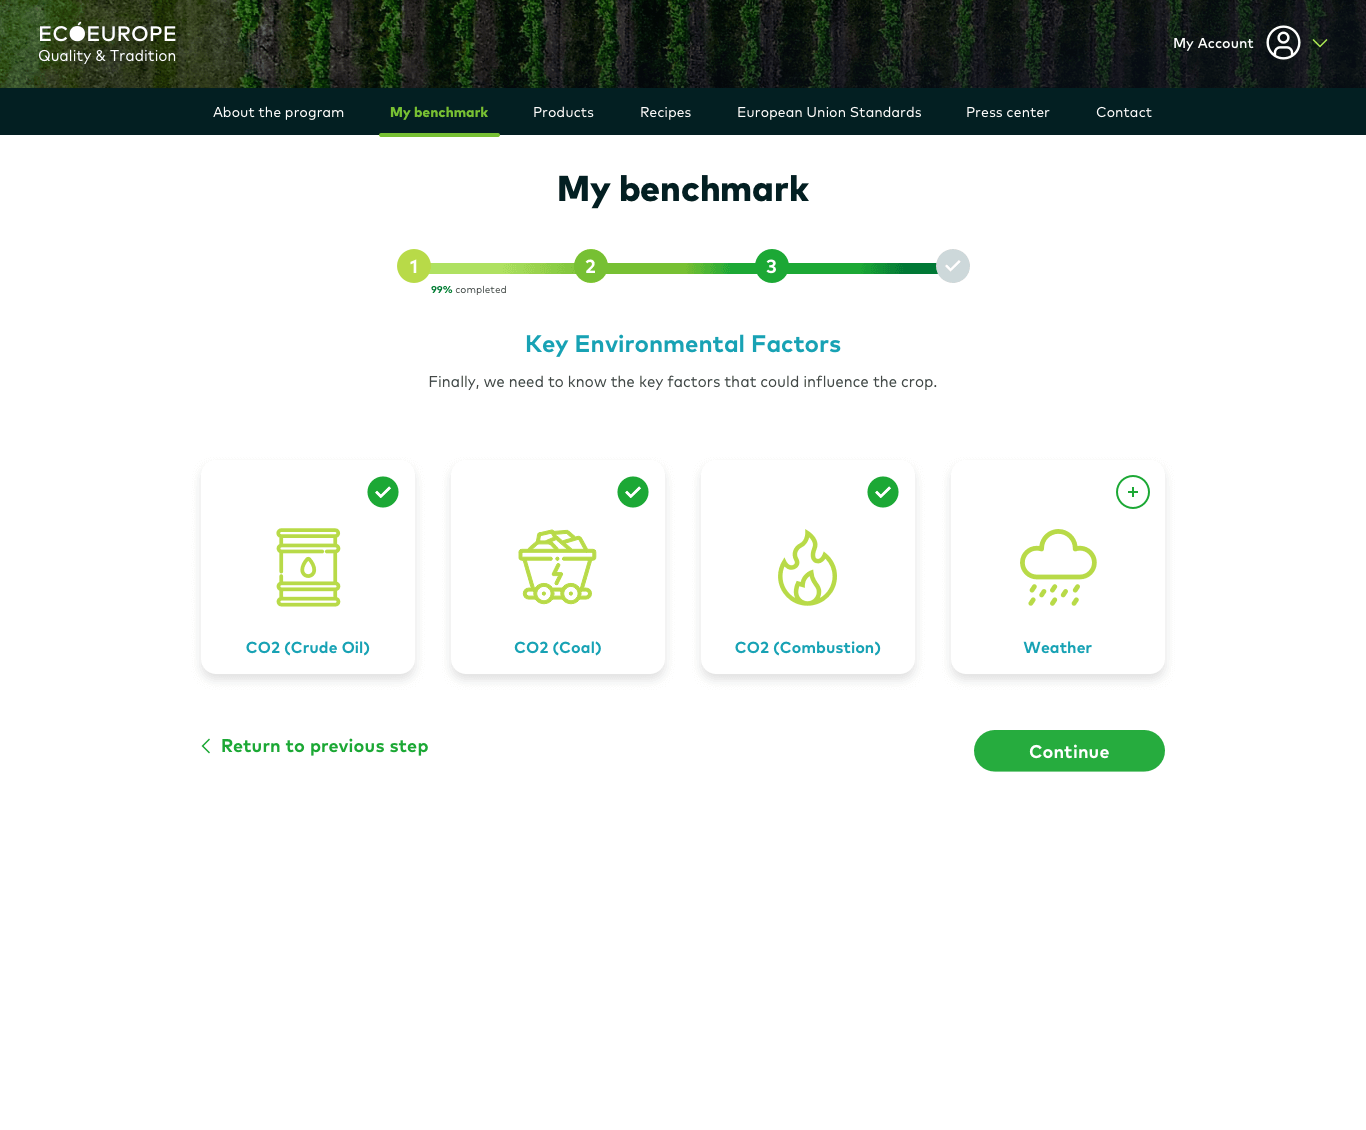
The main doubts when prototyping the experience come from the way we collect user data. The first idea that comes to mind is through the classic form. But not having the knowledge that we would have liked about the necessary data, we finally opted for a process similar to onboarding, in which the user is asked to select in a very simple and visual way the products and other key factors on which they want to obtain information, in order to be able to compare this data later.
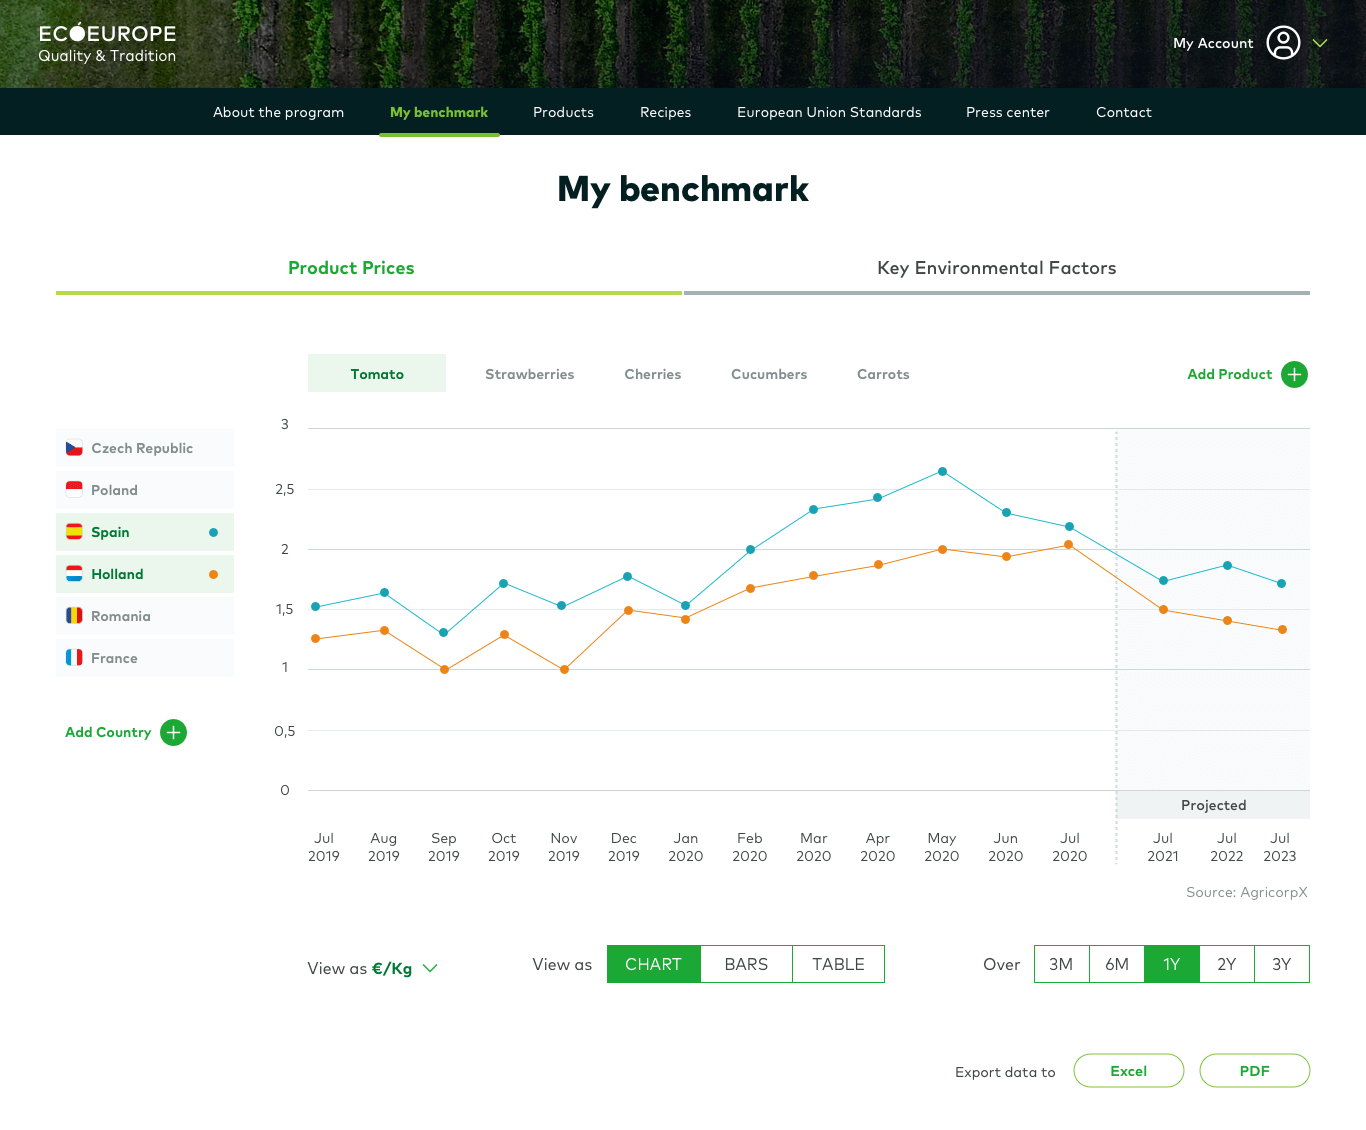
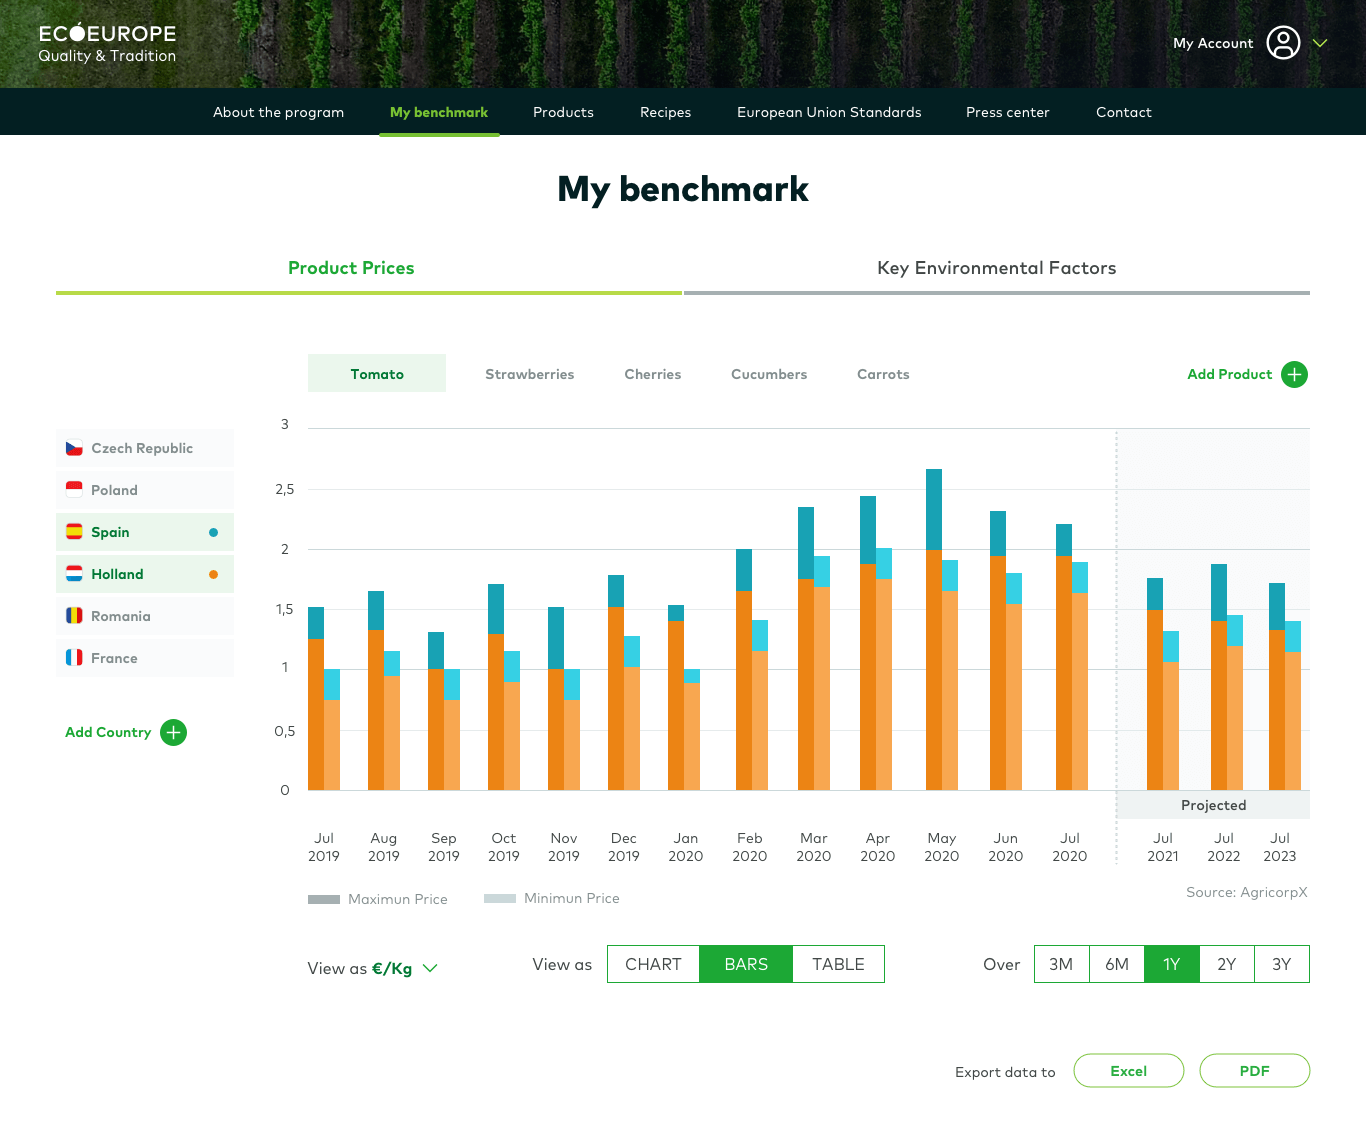
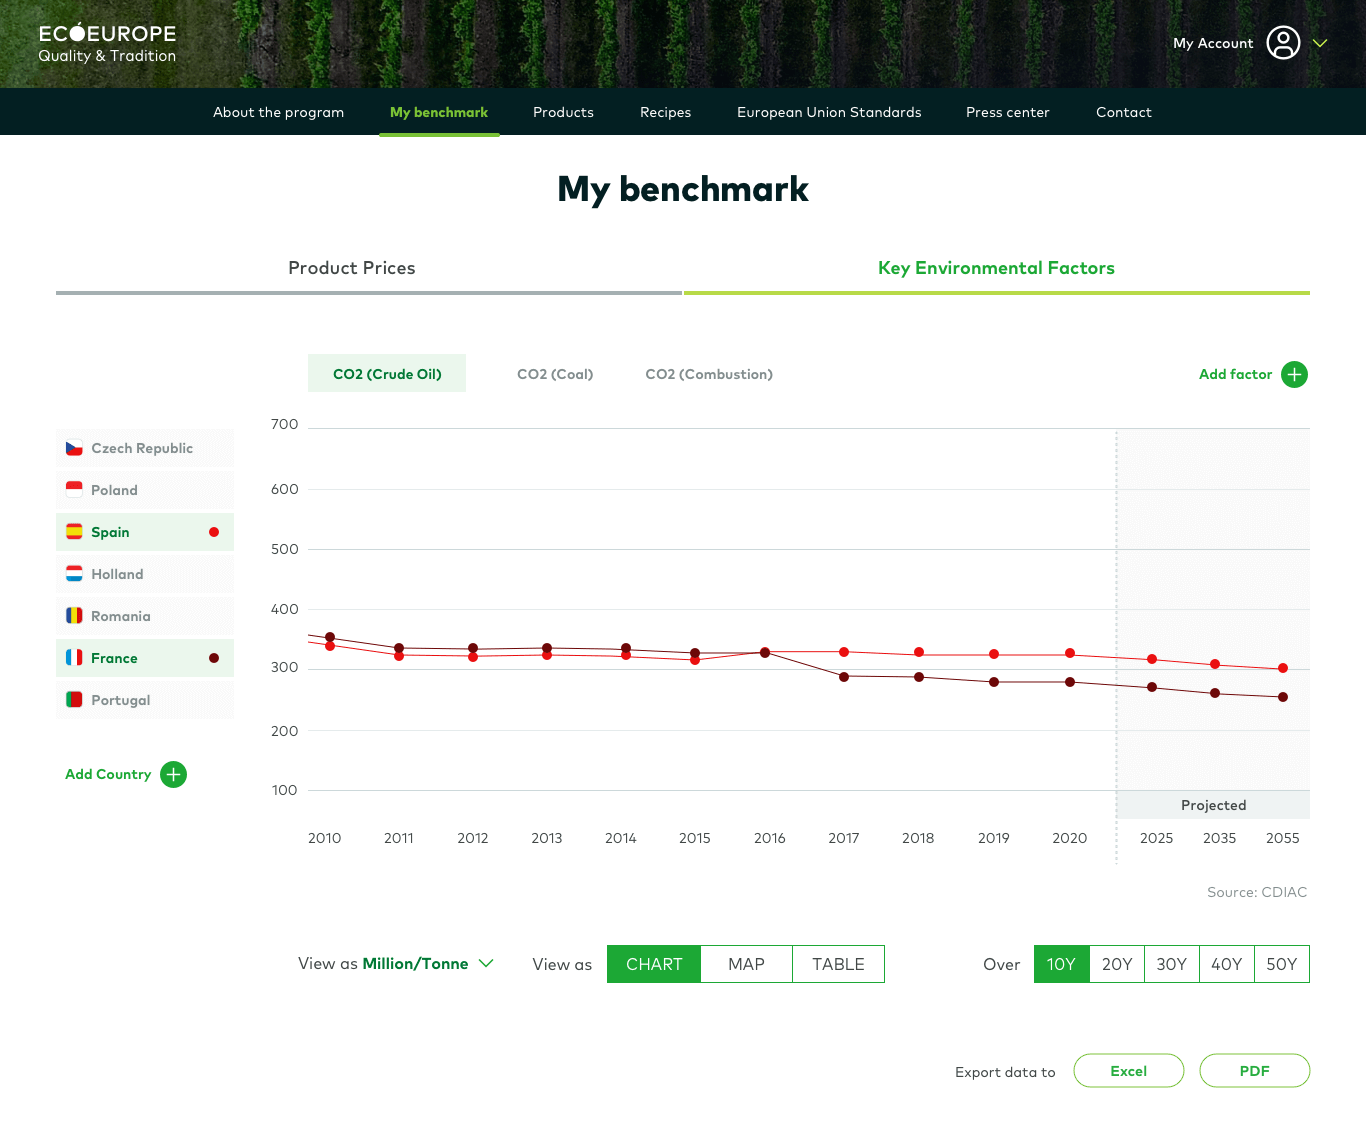
After carrying out a basic user test, the flow of interaction and the way in which the data is taken seem to be intuitive, but in terms of data visualization, combining graphics on the same screen can be overwhelming and takes us away from the "one task, one screen" model that provides the simplicity we were looking for.
On the other hand, different iterations arise as to the location of the interactive elements to control the data that appears in the graphs.
Debido a su diseño anticuado y rudimentario, la gente se siente más cómoda vendiendo sus novedades y artículos menos valiosos. No se sienten tan presionados para tener fotos de alta calidad o descripciones extensas. Perciben que su público tiene expectativas más realistas en cuanto a los artículos de segunda mano.
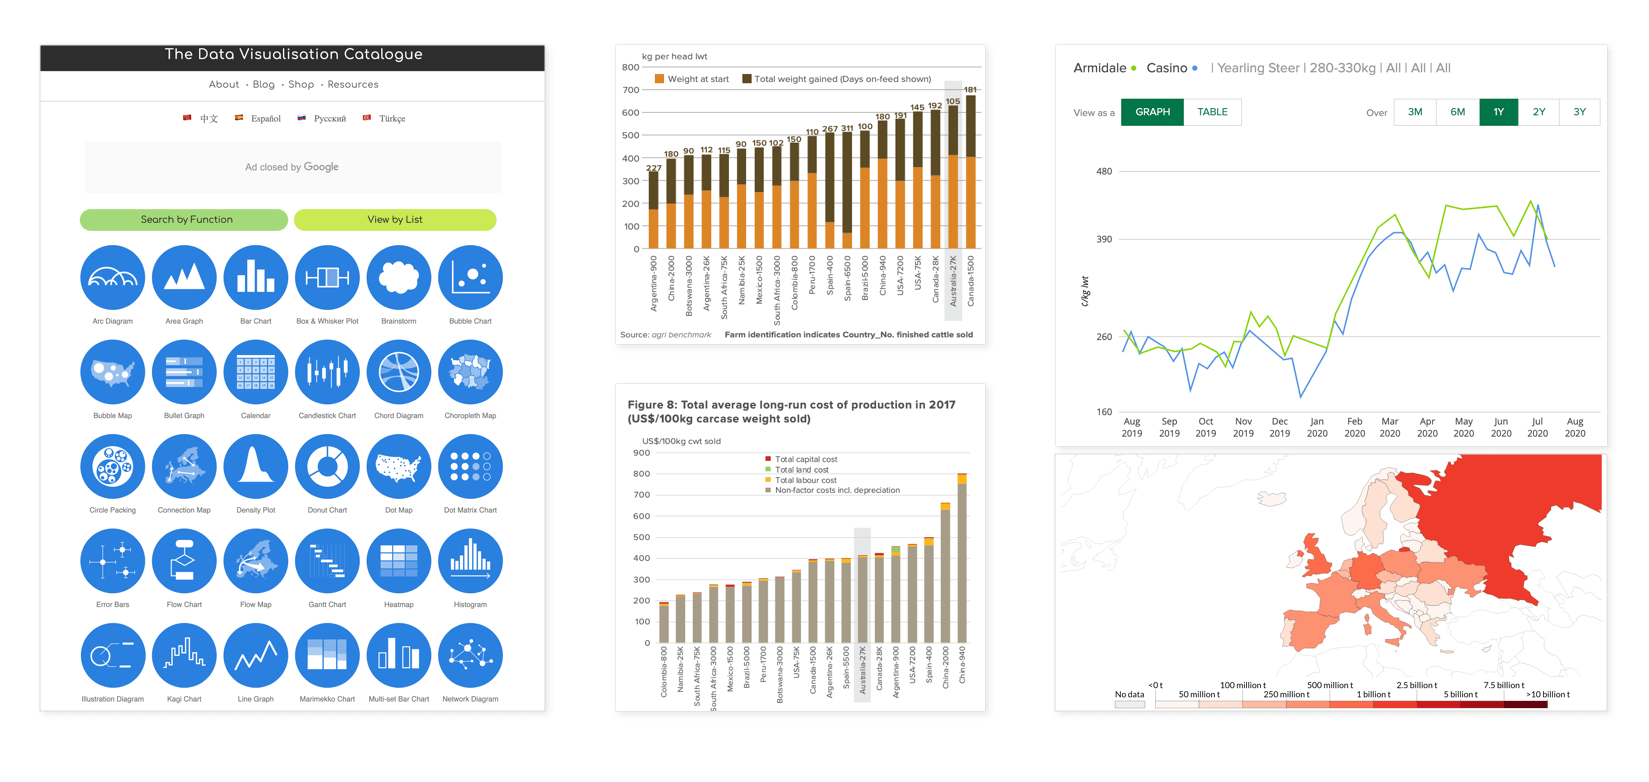
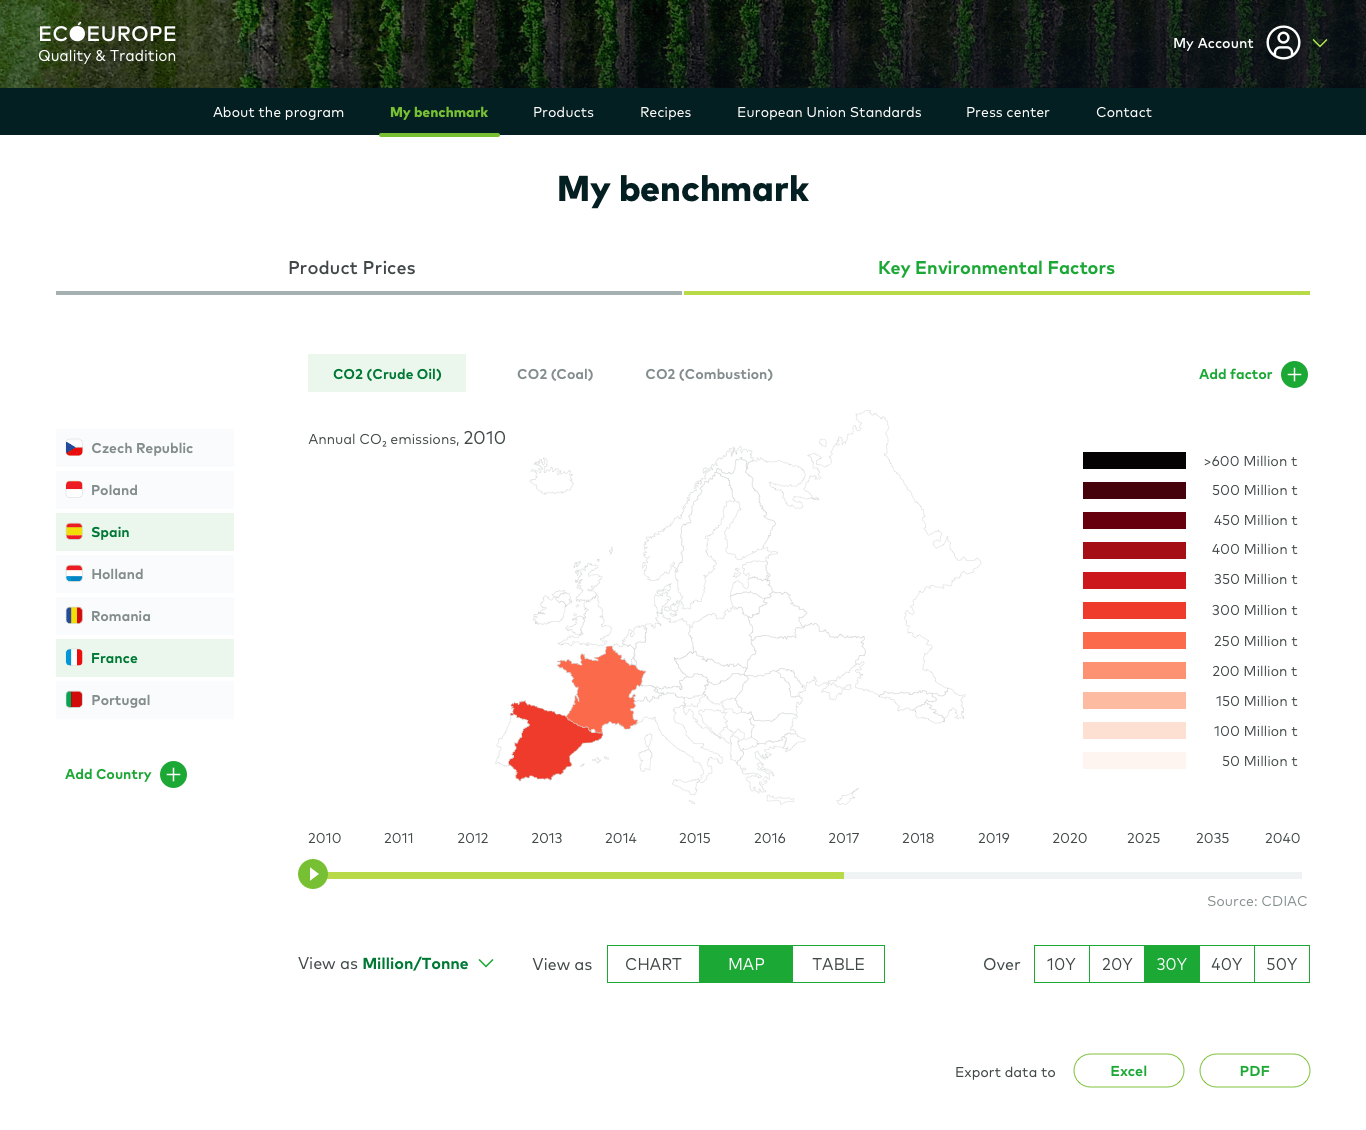
/Data Visualization
The main challenge when it comes to the final design of the tool is the optimal visualization of the information in the available space.
With this objective in mind, we analyzed the best way to visually represent each type of data.
To do this we rely on the benchmark that we made in the research phase, and in the online tool "Data visualization catalogue" that shows us the characteristics of each type of graphic.
/Visual Design
When it comes to taking our design to the visual phase, first of all, we will define the color palette and typography that we will use.
COLOR PALETTE
We will be based on the color palette of the branding of Krajowy Osrodek, the agency behind the ECOEurope project. To its range of greens, we will add harmonic blues and greys that will be very useful when it comes to achieve visual hierarchy in our product. We will use the corporate green for the interactive and fundamental elements so that they stand out from the rest.

TYPOGRAPHY
We will use the Mark Pro font which, apart from being modern, gives us great legibility not only of the text but above all of the data to be shown.

/Final Design
/Prototype
presentation video
Otros trabajos